Financial markets are no longer a battleground for humans; they are dominated by algorithms. Traditional technical analysis methods (RSI divergences, simple moving averages, etc.), when used in isolation, have become easily manipulated by Market Makers.
This raises a question: Can we combine a institutional-grade “Hedge Fund” strategy with modern Artificial Intelligence technologies and run it from our home computer?
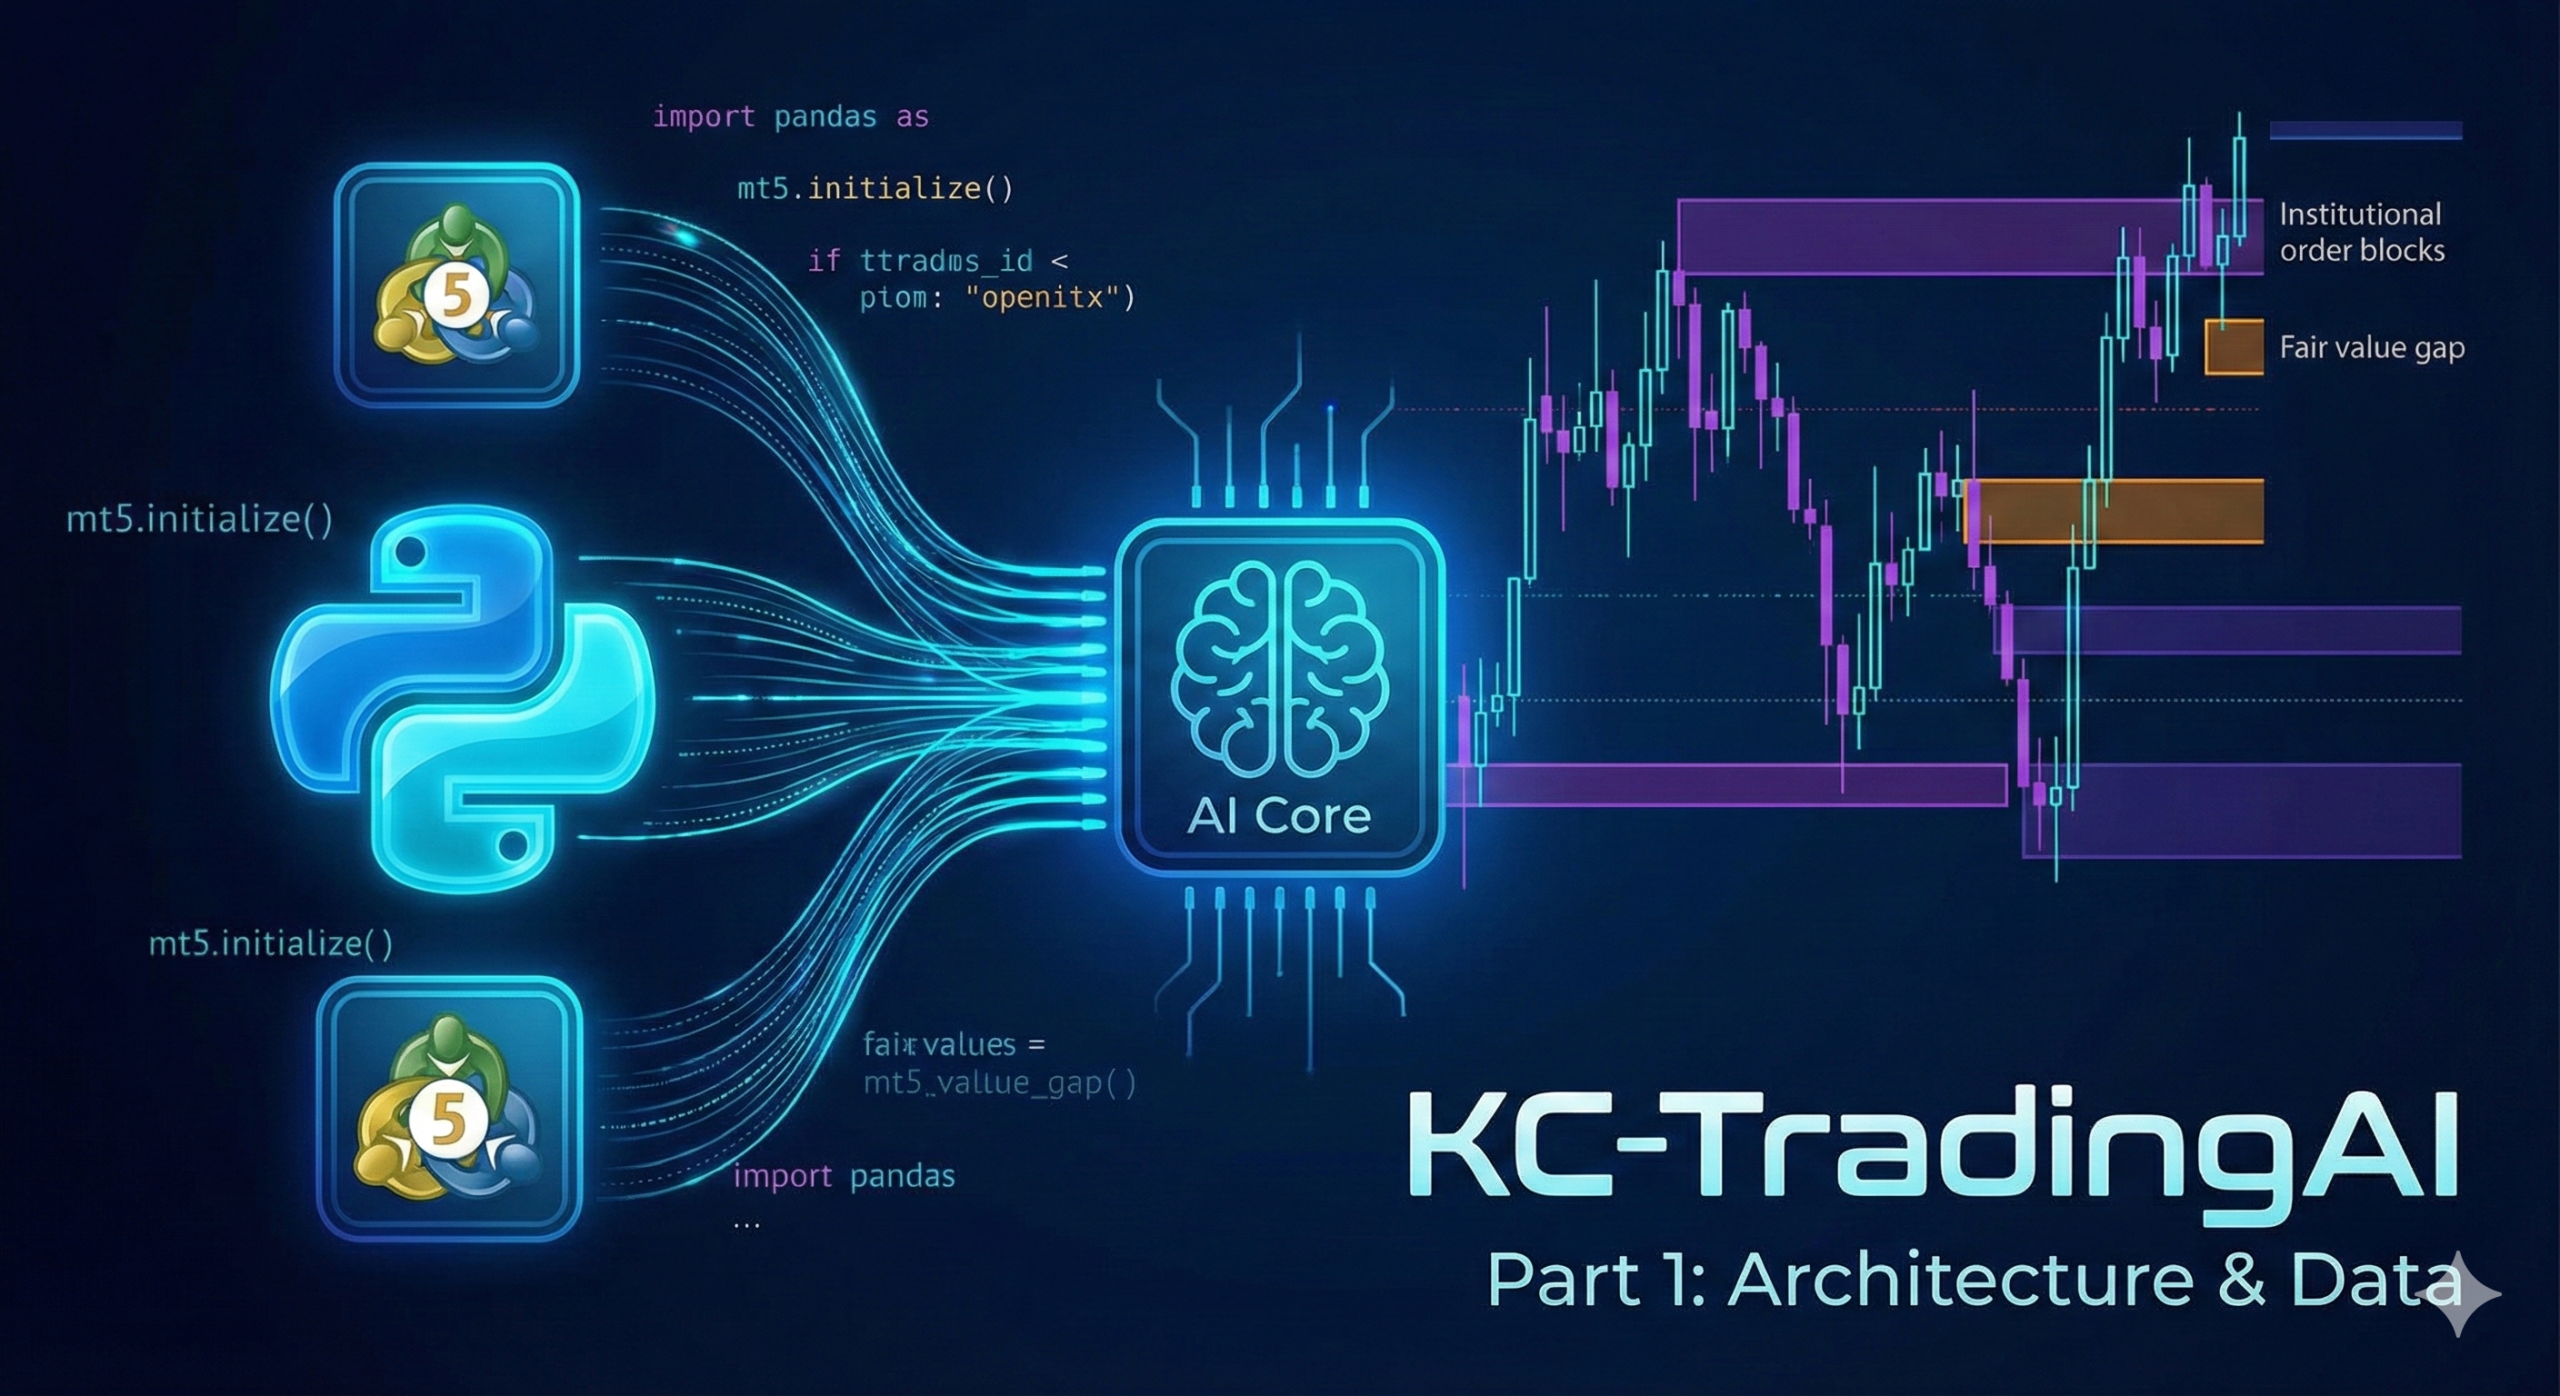
The KC-TradingAI project was born to answer this very question. In this blog series, I will transparently explain the technical architecture and development process of a trading bot I built from scratch. It communicates with MetaTrader 5, performs Price Action and Order Flow analysis, and makes decisions using XGBoost and Reinforcement Learning.
In this first part, we will examine why such a complex structure is necessary and look at the system’s general architecture.
The “Why”: Why a Hybrid Structure?
Most trading bot projects fail because they look at the market through a single window. They either focus solely on mathematical indicators or rely entirely on machine learning, ignoring market dynamics.
In the KC-TradingAI project, I approached the market as the intersection of three different disciplines:
-
Smart Money Concepts (SMC): To understand why price moves (Liquidity, FVG, Order Blocks).
-
Order Flow & Volume: To measure the “fuel” behind the price movement (RVOL, Buyer/Seller Pressure).
-
Artificial Intelligence (AI): To catch patterns the human eye might miss and to make emotionless decisions.
When we combine this trio, we don’t just get a bot that says, “RSI is below 30, buy.” We get a system that says: “Price has reached an institutional Order Block, sellers are exhausted on the volume side (Absorption), and my AI model predicts a reversal with 86% confidence.”
The Architecture of KC-TradingAI
KC-TradingAI is designed as a modular Python application. To avoid “spaghetti code” and make maintenance easier, the system is divided into 5 main layers:
1. Data Layer
The eyes and ears of the system. It connects to the market using the MetaTrader 5 (MT5) Python integration.
-
Multi-Timeframe Data: It doesn’t just look at a single timeframe. It synchronizes and merges M1 (1-minute), M5, and M15 data. This allows it to catch precise entry points on M1 without missing the major trend on M15.
-
Live Data Stream: Processes millisecond data (Tick Data) while the market is open.
2. Feature Engineering
The kitchen where raw data is turned into meaningful signals. Approximately 128 different features are calculated here:
-
SMC Algorithms: The code mathematically calculates FVG (Imbalance) gaps and Liquidity zones on the price chart.
-
Order Flow Metrics: Measures “aggressive” movements inside volume candles.
-
Volatility Analysis: Determines the current mood of the market (calm or stormy?) using statistical data like ATR and Z-Score.
3. Intelligence Layer
The brain team where the decision mechanism resides. A two-stage approval mechanism operates here:
-
Stage 1 (XGBoost): A Supervised Learning model trained on historical data predicts the market direction (BUY/SELL/HOLD).
-
Stage 2 (Reinforcement Learning – RL): Acts like a “Risk Manager.” Even if XGBoost says “Buy,” the RL agent can veto the trade saying, “Volatility is too high right now and our chance of success is low, do not open the trade.”
4. Execution Layer
The part where the decision is put into action.
-
Safe Order Transmission: Orders are transmitted to the exchange via
order_check()andorder_send()functions. -
Dynamic Position Management: Instead of a fixed Stop Loss, dynamic TP/SL levels are determined based on market volatility (ATR).
-
Trailing Stop: As the trade moves into profit, it automatically moves the stop level up to lock in gains.
5. Monitoring Layer
The interface where the system talks to me.
-
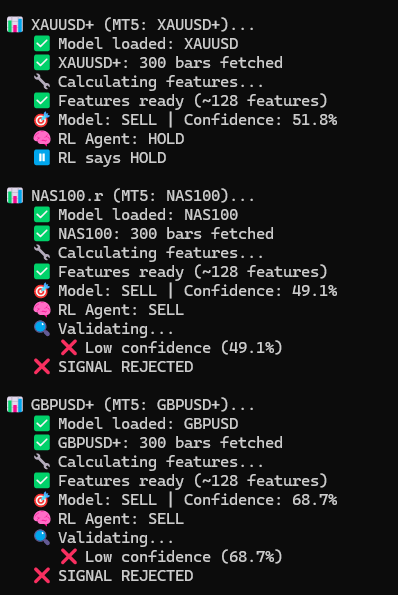
Telegram Bot: Every time a trade is opened, it takes a screenshot of the chart, writes the entry/exit levels and the model’s confidence score on it, and sends it to my phone.
-
Heartbeat: Provides periodic status reports to confirm the system is running.
The Tech Stack
I utilized the following technologies to bring this project to life:
-
Language: Python 3.10+
-
Data Analysis: Pandas, NumPy (Critical for vector calculations)
-
Machine Learning: XGBoost (Classification), Scikit-learn (Data processing), Stable Baselines3 (For optional RL experiments)
-
Financial API: MetaTrader5 Python Library
-
Notification: Telegram Bot API
-
IDE: VS Code
Data Engineering: From Raw Data to Meaningful Signals
There is a famous saying in the world of data science: “Garbage in, garbage out.” Even if you use the world’s most advanced AI model, if you feed it poor quality or meaningless data, the result will be a disappointment.
In this section, we will examine how we transform raw price data (Open, High, Low, Close, Volume) from MetaTrader 5 into 128 different “features” that our algorithm can understand.
1. Bending Time: Multi-Timeframe (MTF) Data Structure
The market is not one-dimensional. While there may be a “Downtrend” on the 1-minute (M1) chart, you might just be experiencing a correction of a massive “Uptrend” on the 15-minute (M15) chart. Bots that look at a single timeframe lose for this reason.
In KC-TradingAI, I applied a Data Merging strategy. The system works as follows:
-
Main Backbone: M1 (1-Minute) data is used as the base. This ensures the bot reacts quickly.
-
The Big Picture: M5 and M15 data are fetched and “spread” over the M1 data using the
Forward Fillmethod.
Thus, while the algorithm sees the current M1 closing price, it also knows the direction of the M15 trend (m15_ema_trend) and the RSI value on the M5 in the same row. This gives the model context awareness.
2. Order Flow: The Whispers of Volume
If price is the speed of a car, volume is the fuel. If the fuel runs out, the car stops. Standard indicators don’t look much at volume, but Order Flow analysis holds a critical place in KC-TradingAI.
Here are some critical metrics I calculated in the code:
-
RVOL (Relative Volume): The ratio of current volume to the average of the last 20 periods. If RVOL > 2.0, there is “institutional” interest in the market.
-
Effort vs Result: Based on the VSA (Volume Spread Analysis) principle. If there is massive volume (High Effort) but the candle body is very small (Low Result), this is an “Absorption” signal; the trend may reverse.
-
Price Velocity: The relationship between the speed of price change and volume. Rapid rises without volume are usually traps; we detect these.
3. Hunting “Smart Money” with Code (SMC Engineering)
This is the most exciting part of the project. How can we teach Python the Fair Value Gap (FVG) or Order Block structures that traders usually draw by eye on the chart? I converted geometric rules into code for this.
A. FVG (Fair Value Gap) Detection
An FVG occurs in a three-candle structure. If there is a gap between the wick of the first candle and the wick of the third candle, there is an imbalance.
Python
# FVG Detection Algorithm (Simplified)
# Bullish FVG: 1st Candle High < 3rd Candle Low
bull_fvg = df['high'].shift(2) < df['low']
gap_size = df['low'] - df['high'].shift(2)
Thanks to this snippet, the model receives information (as 0 or 1) that “Price is currently in a gap zone, this place may work like a magnet.”
B. Order Blocks and BOS
-
Order Blocks: The lowest/highest levels in the last 20 candles are scanned to determine potential institutional order zones. The distance of the price to these zones (
dist_to_ob) is given to the model as a feature. -
BOS (Break of Structure): Continuity of the trend is measured by checking whether the price has broken the last peak (Swing High).
C. RBR and DBD Patterns
Areas where price makes “Rally-Base-Rally” (Rise-Wait-Rise) or conversely “Drop-Base-Drop” are supply-demand zones. My algorithm automatically labels these patterns by looking at the size of the candle bodies.
4. Statistical Normalization
AI models do not like raw prices (e.g., 65,000 for Bitcoin, 1.08 for EURUSD). Therefore, we need to “normalize” all technical data.
Here, Z-Score comes into play. I calculate how many standard deviations the price deviates from the moving average.
-
If Z-Score is +3: Price is statistically extremely expensive.
-
If Z-Score is 0: Price is at the average.
Thanks to this transformation, the model can focus solely on the state of “extremity,” regardless of what the asset’s price is.
Conclusion of Part 1
As a result of all these processes, we have a giant matrix with 128 columns containing trend, volume, institutional footprints, volatility, and statistical deviations, not just a simple table with OHLCV data.
The human brain cannot process 128 different data points simultaneously and make a decision, but Artificial Intelligence can do this in milliseconds.
In the next part, we will dive into the “Intelligence Layer”. We will examine how KC-TradingAI uses XGBoost and Reinforcement Learning to make trading decisions and how it manages risk automatically.